Dashboard Overview
The Browserless dashboard is your central hub for managing your browser automation infrastructure. Access it by logging in at browserless.io/account.
Account
Home
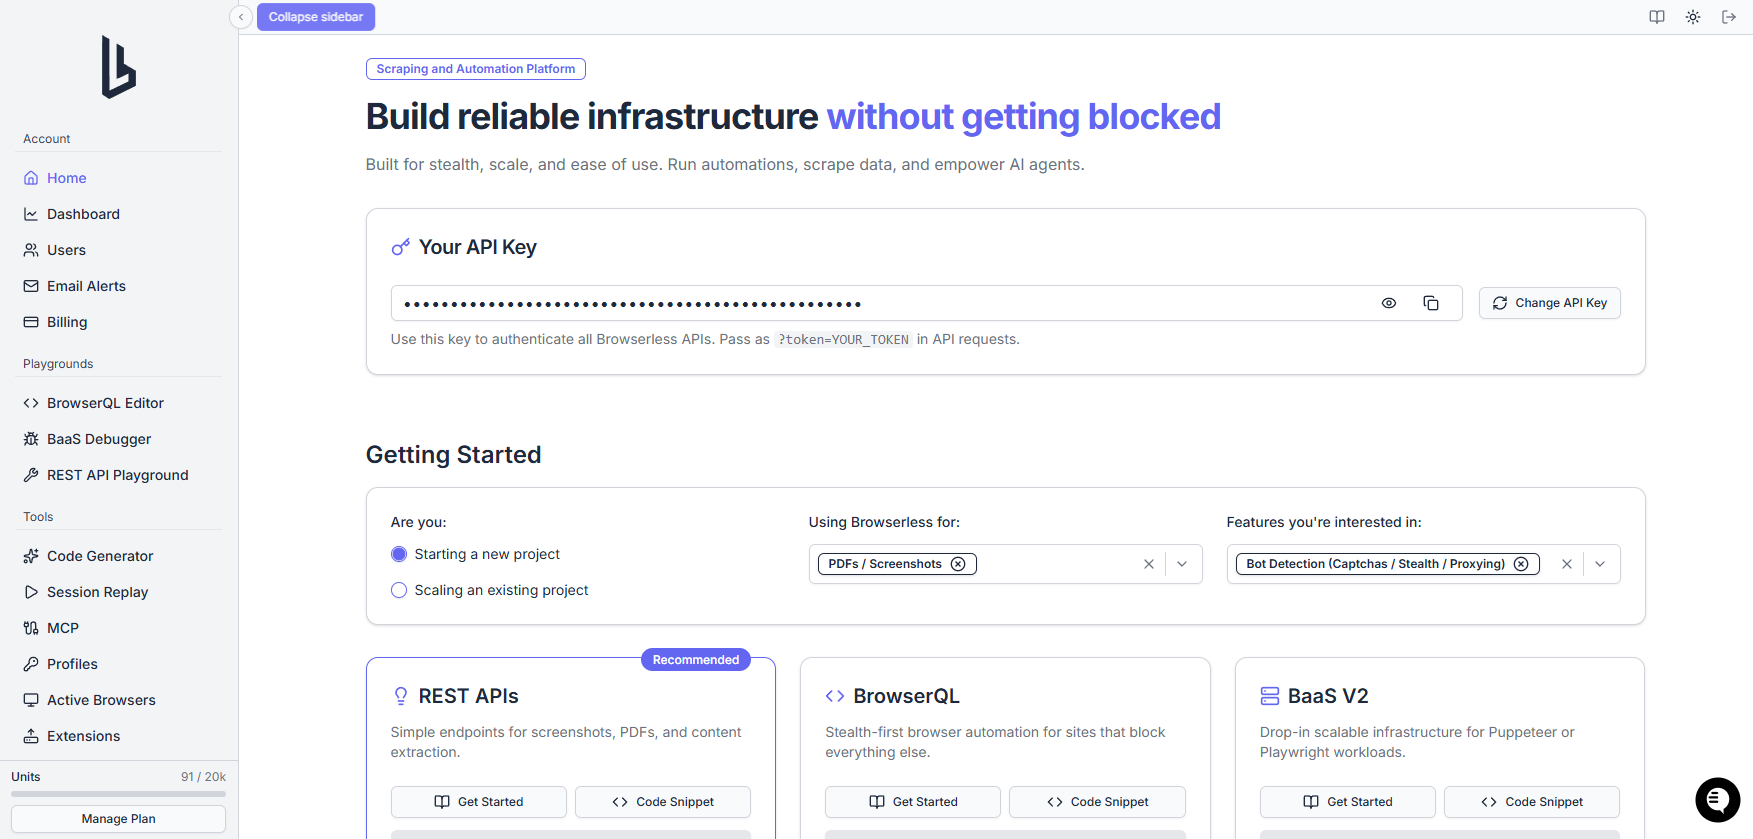
The account home page displays your API token and an interactive Getting Started section to get a personalized recommendation on what API to use for your project.
Dashboard
The dashboard page provides usage monitoring with interactive charts (hour/day/week aggregation) and status cards.
From the dashboard you can also:
- Export data — download your usage metrics via the Export Data modal
- View active sessions — open the Sessions modal to see currently running sessions
- Track cloud usage — see units used and available, concurrency limit, and billing cycle reset date
Playgrounds
BrowserQL Editor
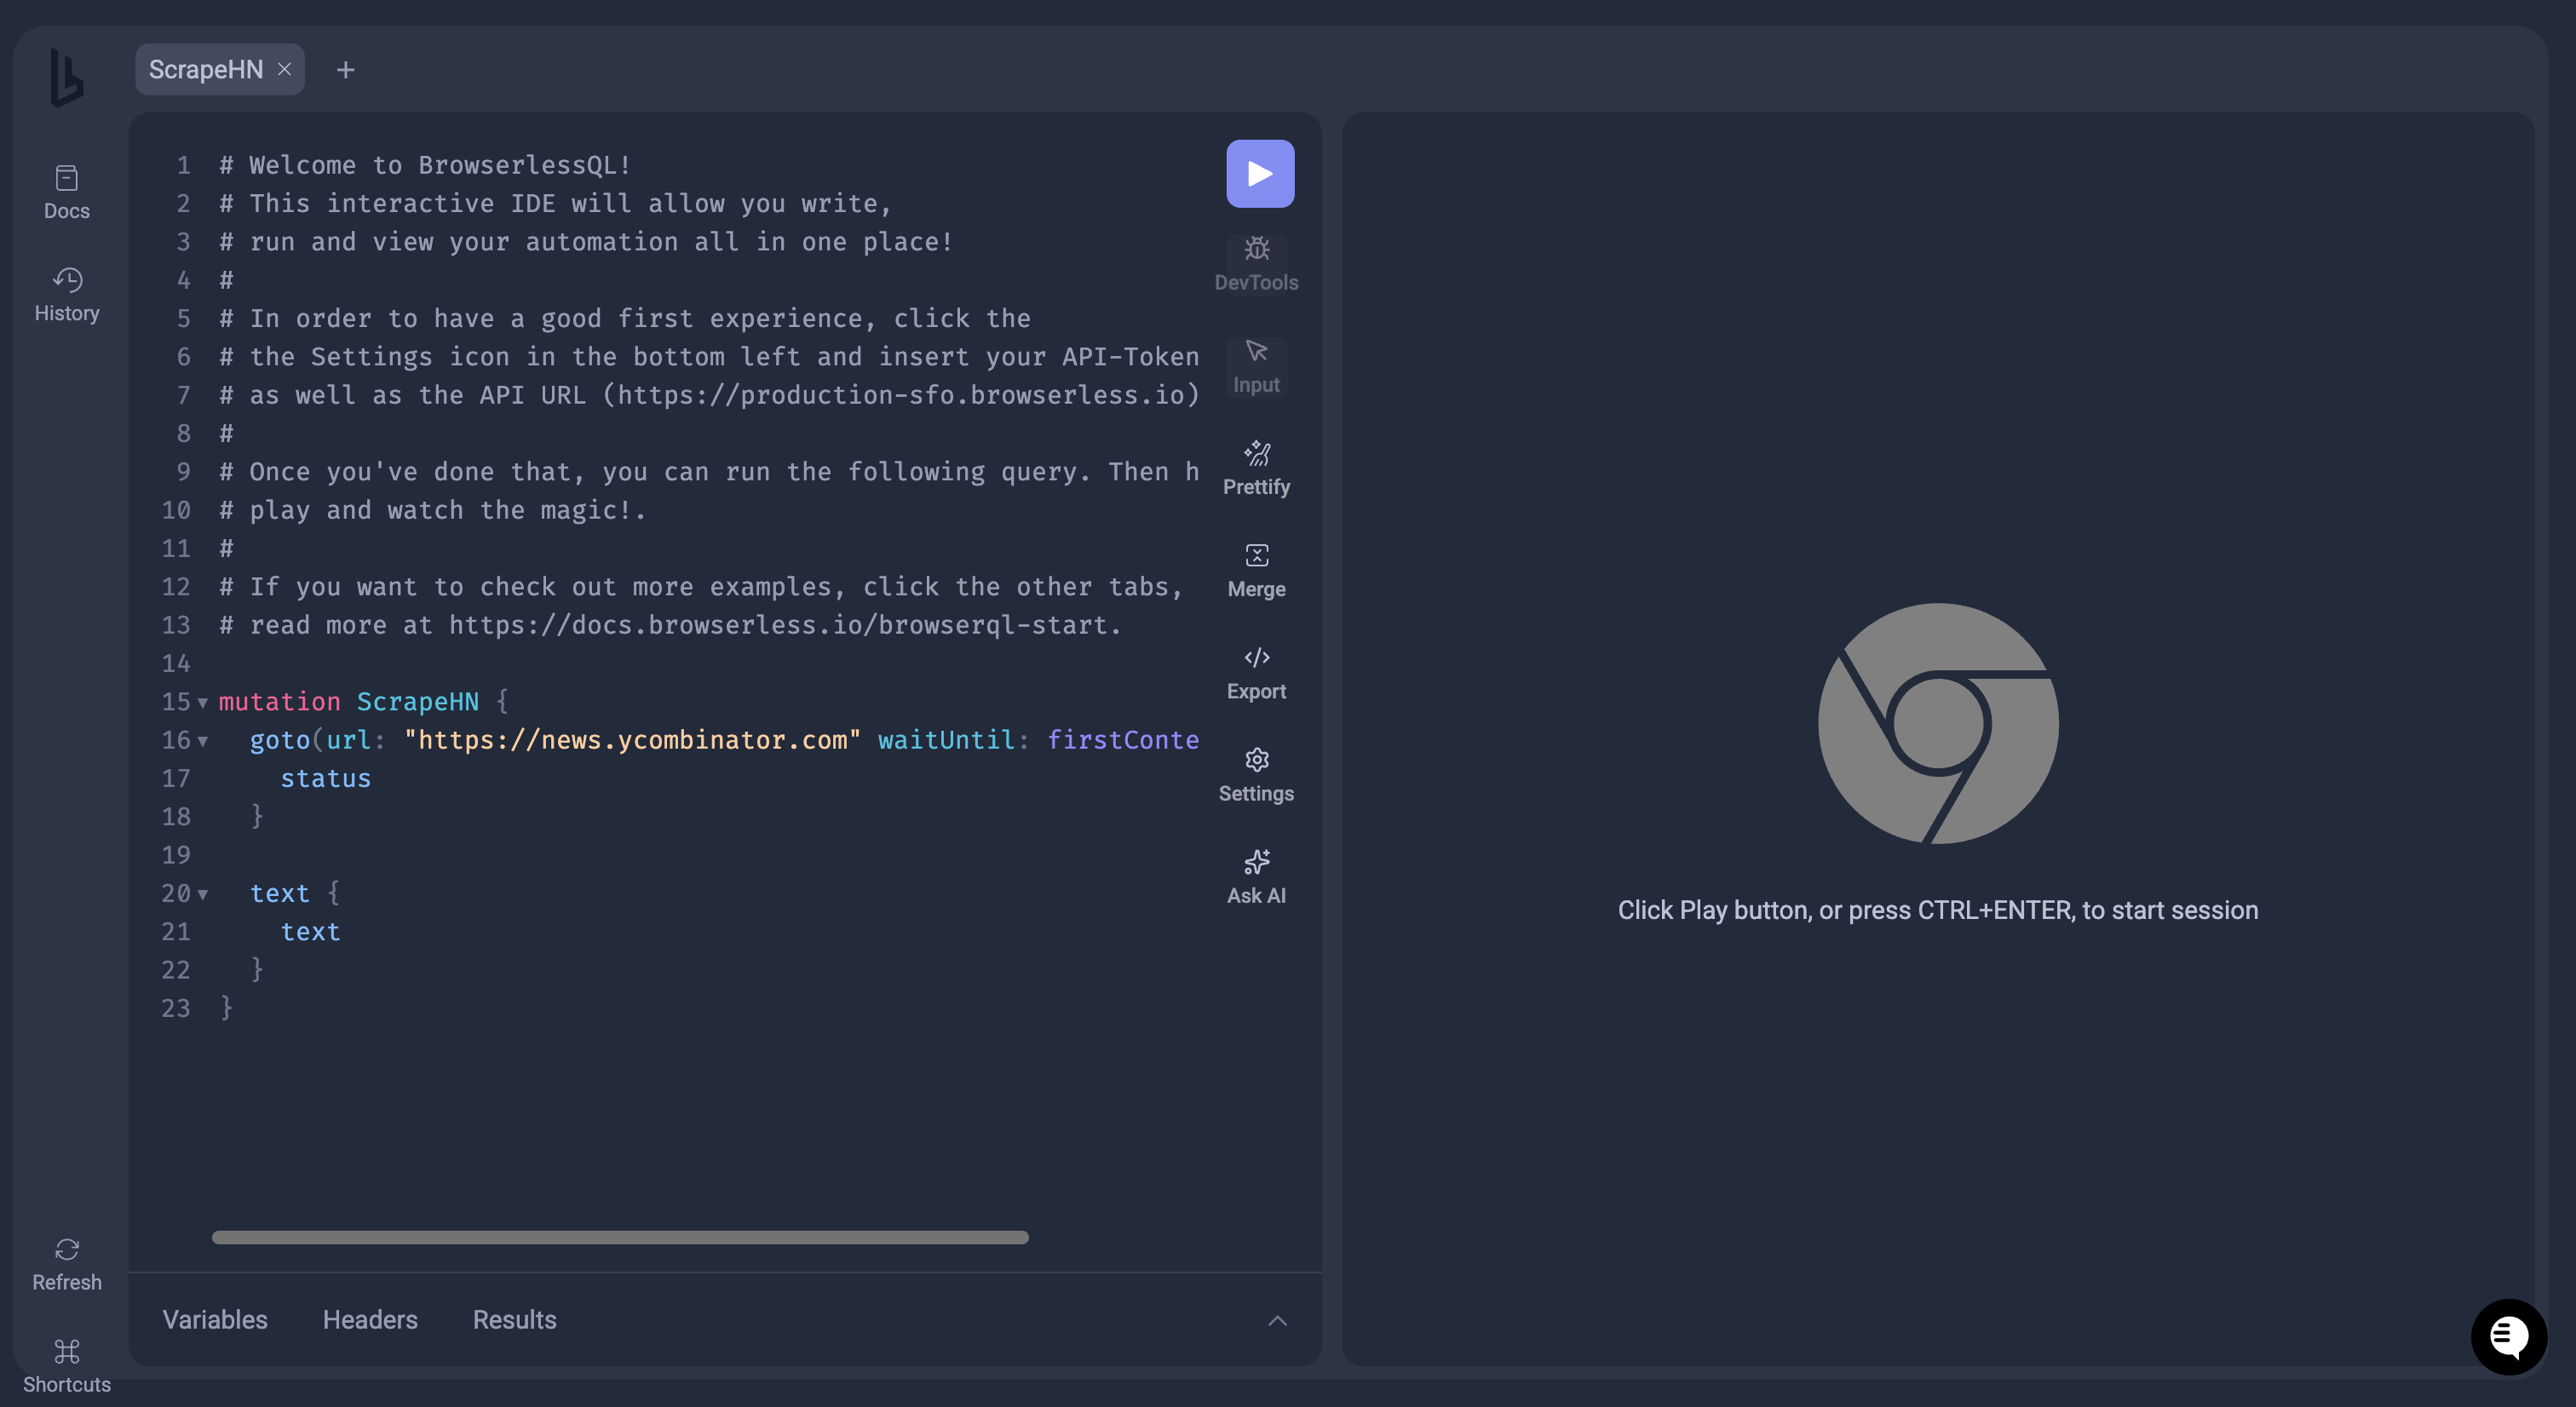
An interactive IDE for writing and testing BrowserQL queries directly in the browser.
- Autocomplete — GraphQL editor with inline suggestions as you type
- Live execution — run queries against real browsers in real time
- Save and share — store queries and share them with your team
BaaS Debugger
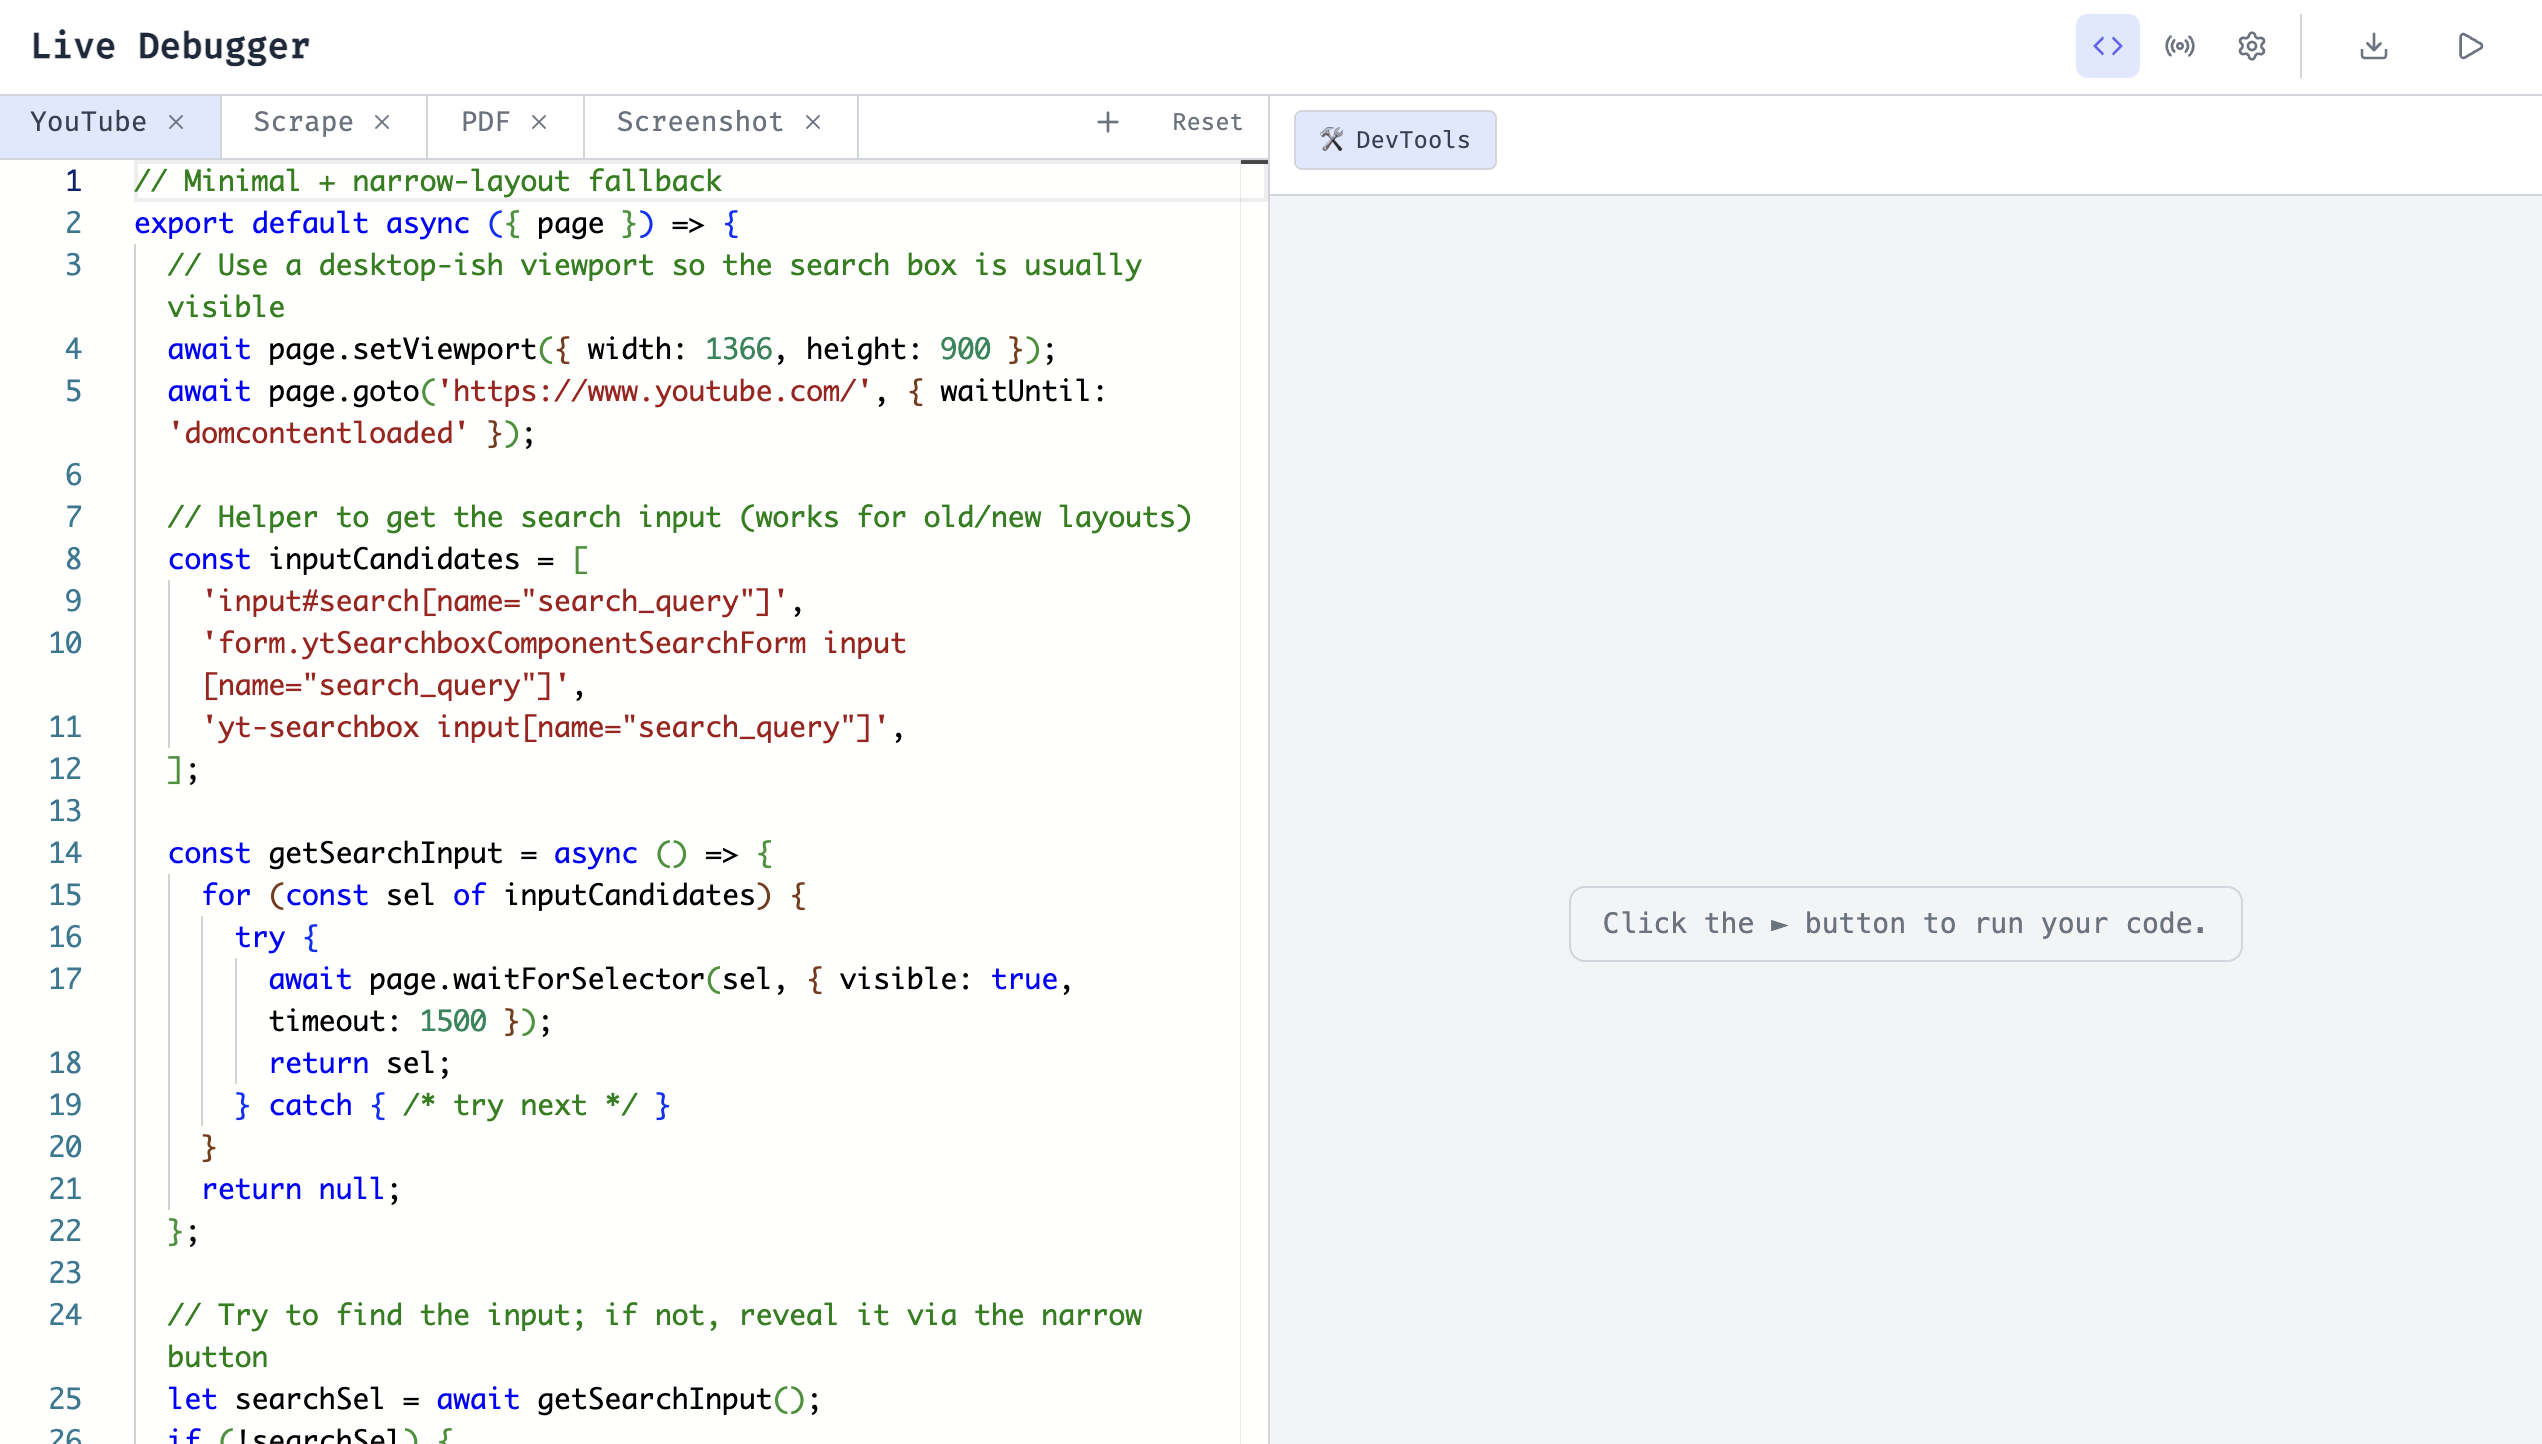
A live code editor and runner for BaaS Puppeteer scripts with a real-time browser preview.
- Code editor — write Puppeteer scripts with syntax highlighting
- Live preview — watch the browser execute your code in real time
- Export — download your script as a complete Node.js project
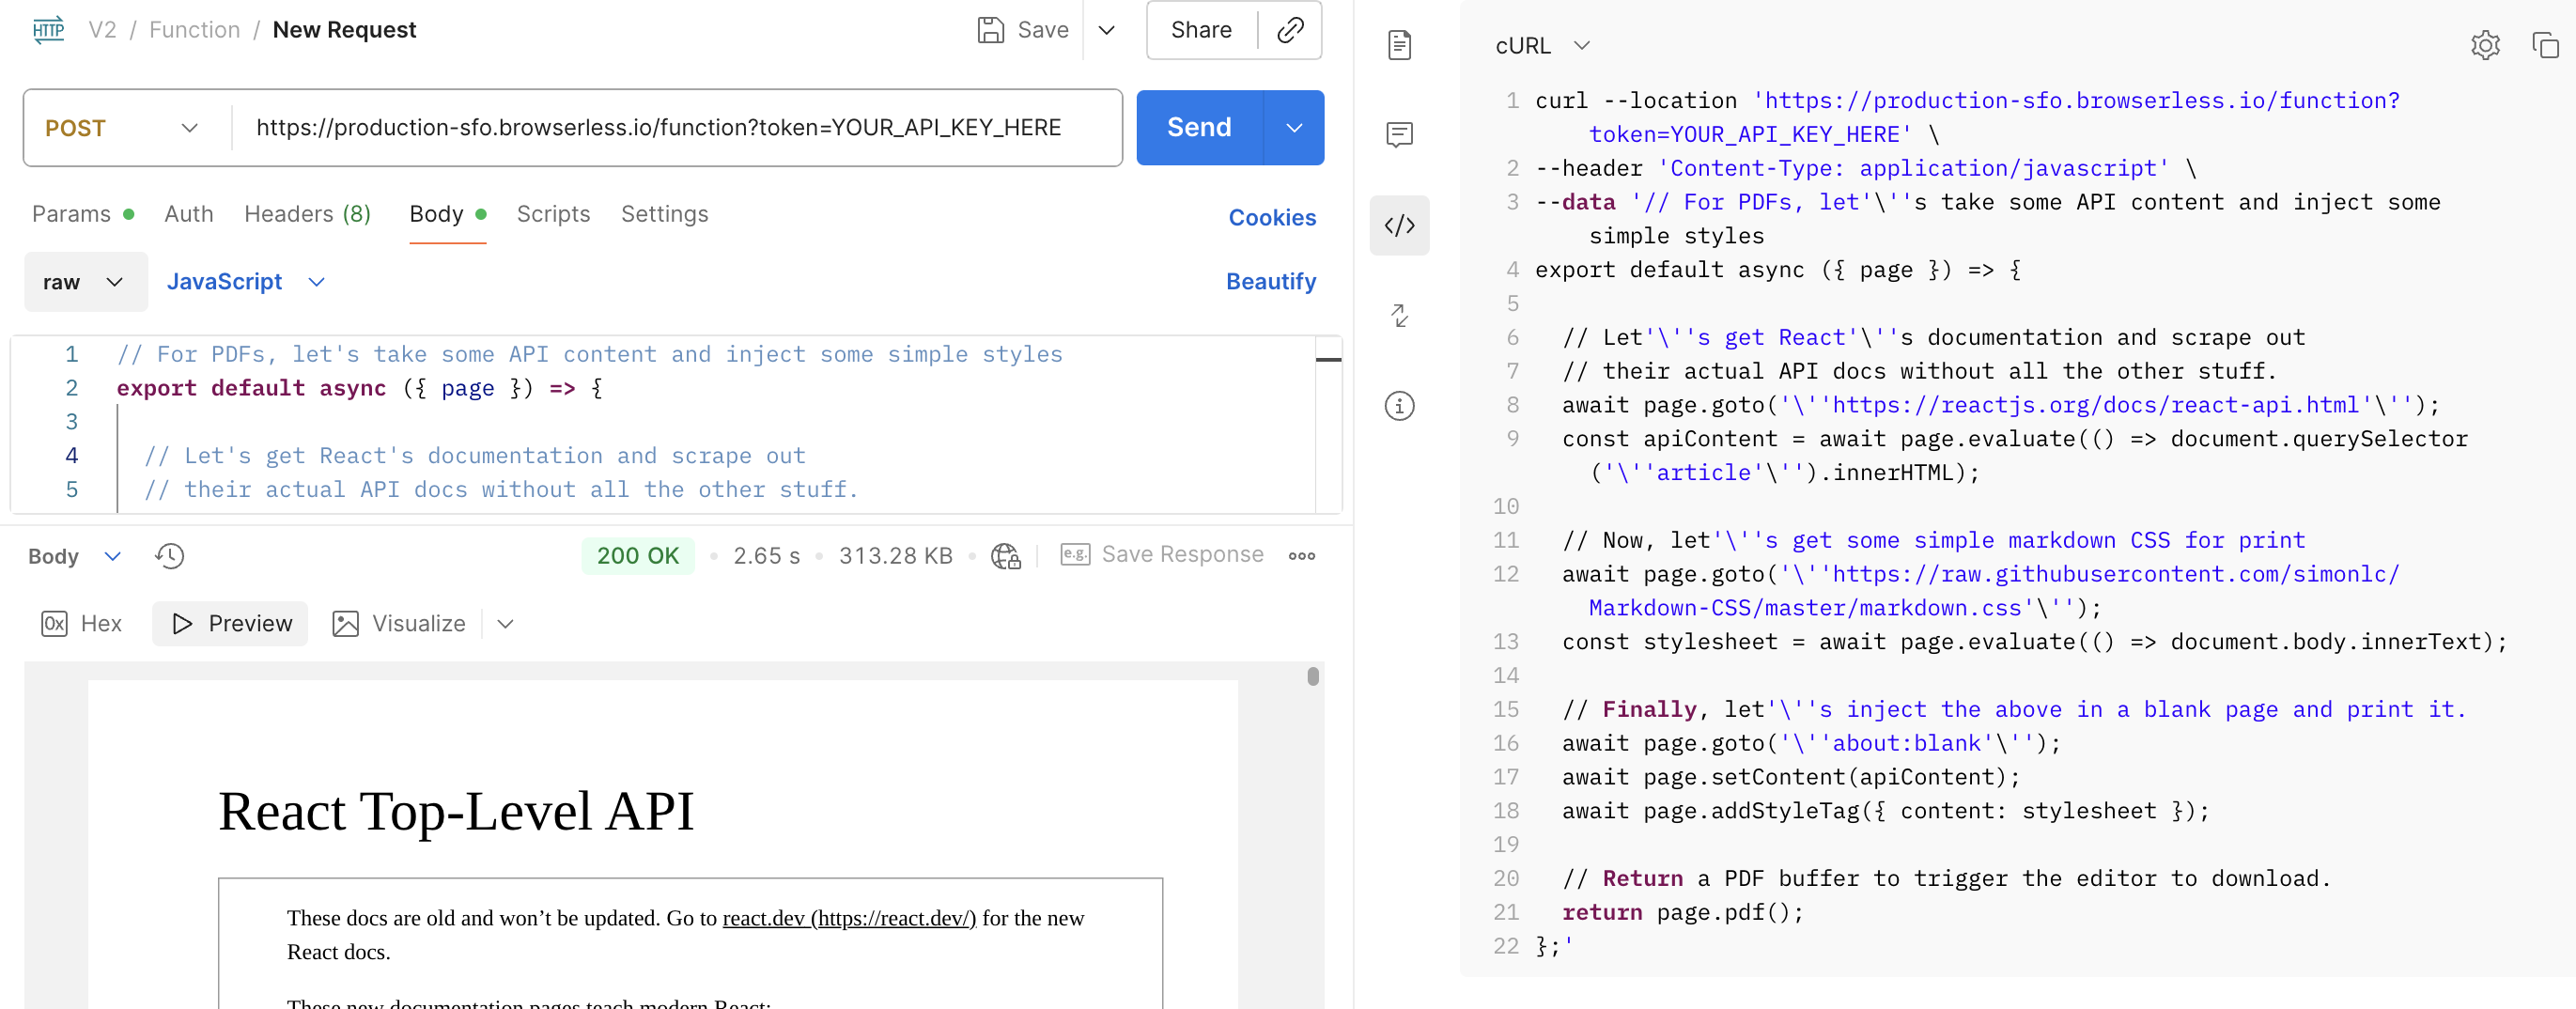
If you'd prefer not to install Puppeteer locally, send your debugger code directly to the /function API as an HTTP request. This lets you run your code through clients such as N8N, Make, Zapier, or any conventional HTTP tool.
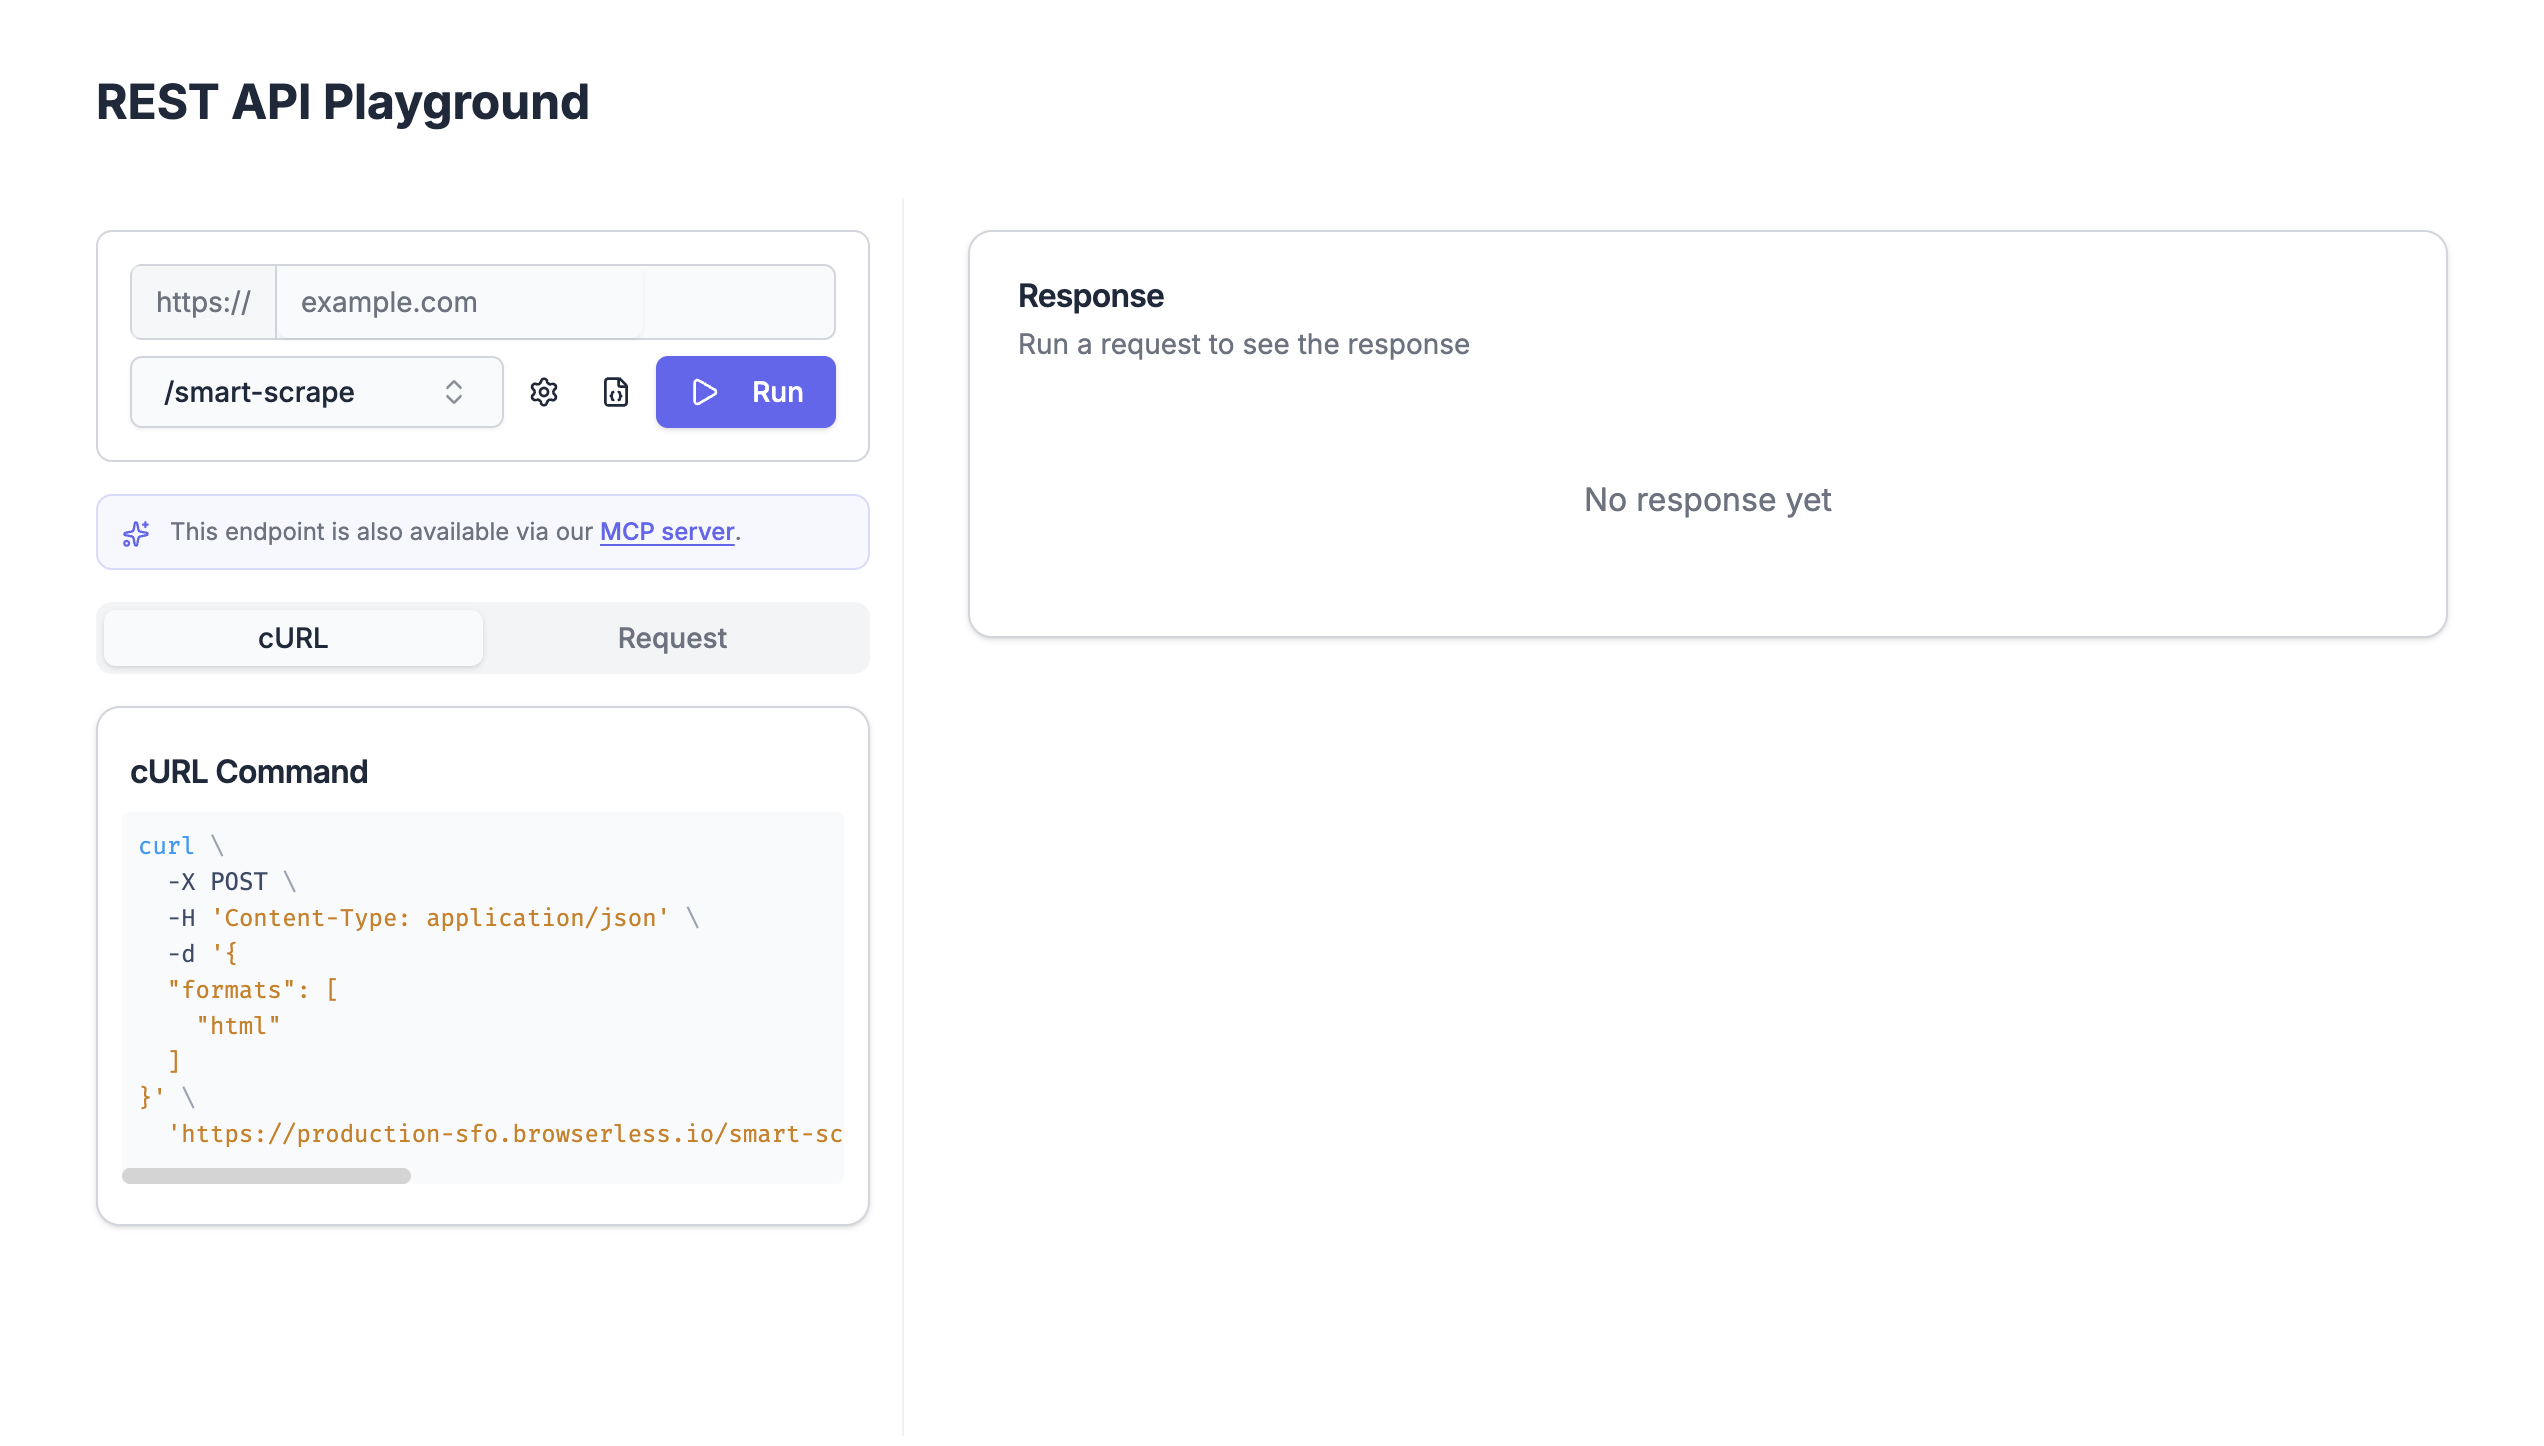
REST API Playground
An interactive testing environment for REST API endpoints, dynamically generated from the OpenAPI spec. See the API Playground guide for a full walkthrough.
- Endpoint picker — select from available endpoints including smart-scrape, function, download, export, search, map, and crawl
- Request configuration — set browser type (Chromium, Chrome, Edge), region, and API token
- Live execution — run requests and view formatted responses
Tools
Code Generator
An AI-powered code generator that creates browser automation scripts from natural language descriptions.
- Natural language input — describe what you want to automate and the AI generates the script
- Format selection — generate code in BrowserQL, JavaScript (Playwright), or Python (Playwright)
- Live browser preview — watch the AI interact with a real browser during generation
Session Replay
View and debug recorded browser sessions with interactive DOM-based replays.
- Search and filter — find sessions by ID or website, filtered by date range
- Playback controls — replay sessions with a timeline view in a dedicated player
- Download options — export as a standalone HTML player or raw rrweb JSON
Profiles
Saved browser sessions that can be attached to any automation run for persistent authentication.
- Interactive creation — launch a live browser session to log in and save cookies and authentication data
- Profile management — create, rename, and delete profiles across your account
- Attach to runs — use saved profiles in automation runs to skip repeated login steps
Active Browsers
Monitor and manage currently running browser sessions.
- Session list — view active sessions with browser type, start time, and timeout duration
- Terminate sessions — stop any running session with a confirmation dialog
- Status indicators — see session status and type badges at a glance
Extensions
Manage Chrome browser extensions that can be loaded into your Browserless sessions.
- Upload extensions — upload ZIP files of Chrome extensions (Manifest v2 or v3) with a custom name and description
- Extension list — view all uploaded extensions with name, description, status, and creation date
- Launch integration — enable extensions in sessions by adding them to your launch options