Live Debugger
Debugging scripts for headless browsers is probably the most frustrating and time-consuming part of the development cycle. Internal IDE and Runtime debugging tools have many limitations for external processes, and taking screenshots at every step is only effective to a certain extent. External debugging libraries are also incovenient to set up and clean up.
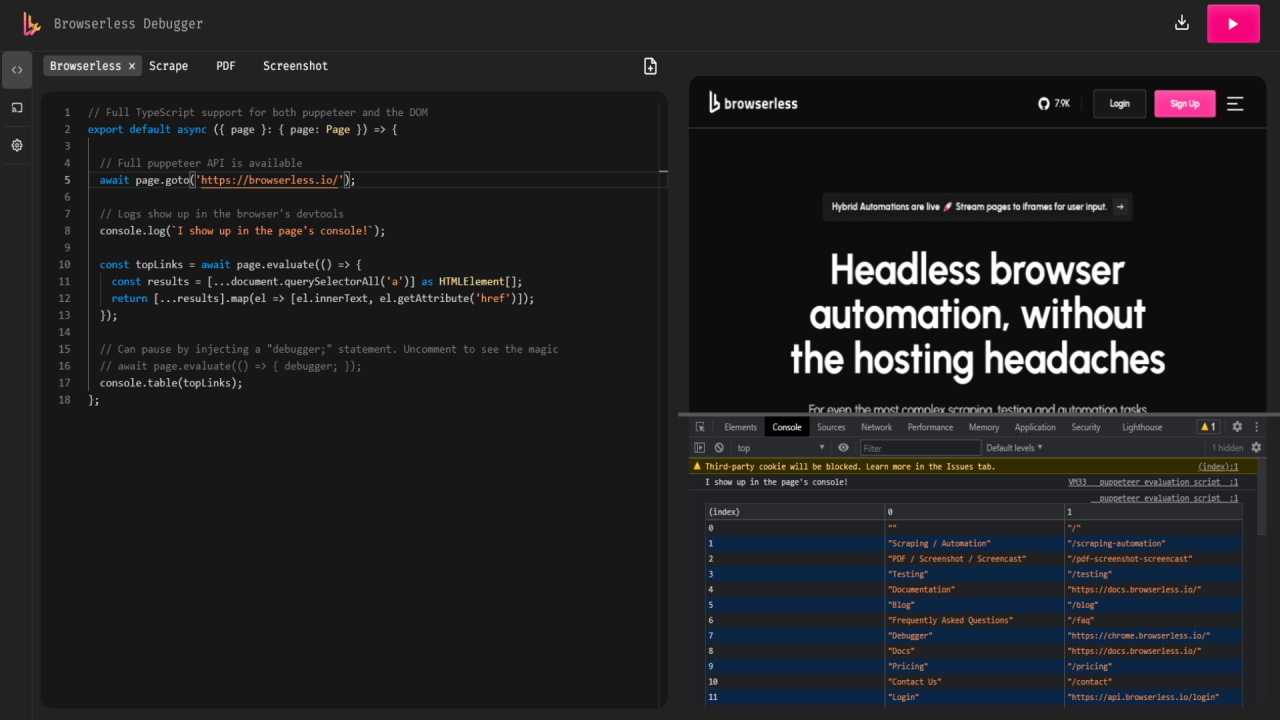
At Browserless, we want the headless browser development (and production) experience to be a effortless task, and that's why we ship a Live Debugger with our Chromium docker images. Some key features include:
- An editor with syntax highlighting and auto-completion.
- Typescript support.
- A visual screencast of the browser that you can interact with.
- The ability to interact with the browser's DevTools.
- File downloading for testing PDFs/PNGs.
- Control over browser-specific parameters like headless and stealth.
- A tab-based layout with code-saving capabilities.
- The ability to save your code to disk as a NodeJS project.
Running the debugger
As mentioned above, all Chromium images include the debbuger. Therefore, you can just run Browserles as usual:
$ docker run --rm -p 3000:3000 -e "TOKEN=6R0W53R135510" ghcr.io/browserless/chromium
You will then see the debugger url during the startup process.
---------------------------------------------------------
| browserless.io
| To read documentation and more, load in your browser:
|
| OpenAPI: http://0.0.0.0:3000/docs
| Full Documentation: https://docs.browserless.io/
| Debbuger: http://0.0.0.0:3000/debugger/?token=6R0W53R135510
---------------------------------------------------------
Then, go to http://localhost:3000/debugger/?token=6R0W53R135510 in your browser and you'll get the debugger:
You can connect to a local or remote websocket enpoint, as long as it's a Chome/Chromium CDP connection. The Live Debugger also allows you to set custom launch flags and set session parameters.