Live Debugger
The Live Debugger described on this page is a tool available on self-hosted containers. Our hosted Live Debugger which you can access from your account page is a standalone tool that does not debug sessions you run from your code, it'll only work within that sandbox. For debugging approaches using your scripts running outside of the live debugger, we recommend using either the Hybrid feature in v2 or the BrowserQL Editor.
Debugging scripts for headless browsers is probably the most frustrating and time-consuming part of the development cycle. Internal IDE and Runtime debugging tools have many limitations for external processes, and taking screenshots at every step is only effective to a certain extent. External debugging libraries are also incovenient to set up and clean up.
At Browserless, we want the headless browser development (and production) experience to be a effortless task, and that's why we ship a Live Debugger with our Chromium docker images. Some key features include:
- An editor with syntax highlighting and auto-completion.
- Typescript support.
- A visual screencast of the browser that you can interact with.
- The ability to interact with the browser's DevTools.
- File downloading for testing PDFs/PNGs.
- Control over browser-specific parameters like headless and stealth.
- A tab-based layout with code-saving capabilities.
- The ability to save your code to disk as a NodeJS project.
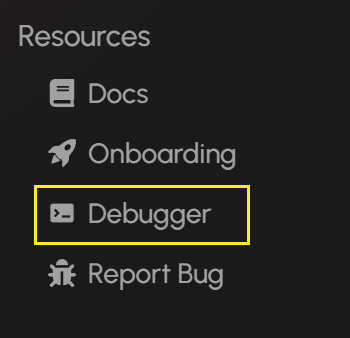
Inside your Browserless account, you will see an option in the menu linking to the debugger, under the Resources section:
And you will se the Live Debugger:
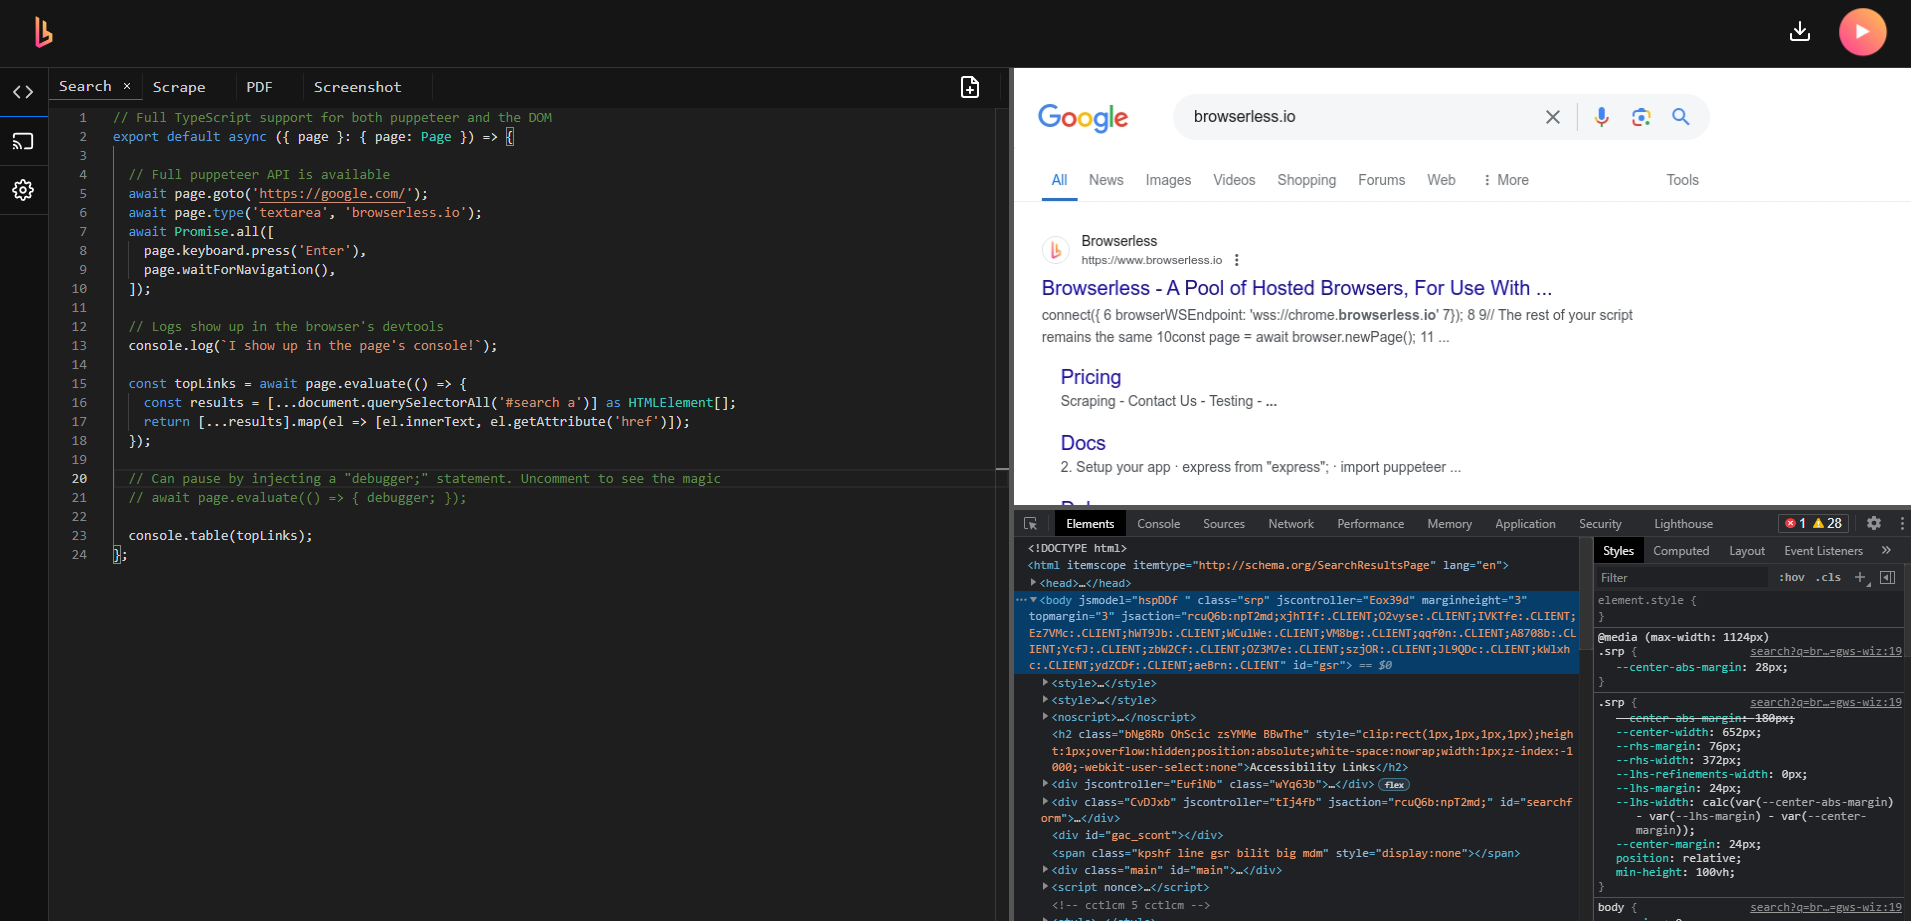
There you will be able connect to your worker's websocket enpoints, to set custom launch flags, and set session parameters.
1. Hybrid Feature in v2
For libraries like Puppeteer and Playwright, we recommend using our Hybrid automation feature which allows you to:
- Stream remote headless browsers to users via a shareable URL
- Detect when captchas are found on the page
- Allow human intervention in automation workflows
- Continue automation after human interaction is complete
2. BrowserQL Editor
For real-time session viewing and debugging, we recommend using the BrowserQL Editor, which provides:
- A live view of the browser session in the right panel
- Built-in documentation and debugging tools
- The ability to create and test queries before integrating them into your code
- Advanced session settings and configuration options
To access the BrowserQL Editor:
- Log into your Browserless account at account.browserless.io
- Navigate to the BQL section in the sidebar menu
- Or go directly to https://account.browserless.io/bql
For more information about BrowserQL and its features, see our BrowserQL documentation.