Live Debugger
Debugging scripts for headless browsers is probably the most frustrating and time-consuming part of the development cycle. Internal IDE and Runtime debugging tools have many limitations for external processes, and taking screenshots at every step is only effective to a certain extent. External debugging libraries are also incovenient to set up and clean up.
At Browserless, we want the headless browser development (and production) experience to be a effortless task, and that's why we ship a Live Debugger with our Chromium docker images. Some key features include:
- An editor with syntax highlighting and auto-completion.
- Typescript support.
- A visual screencast of the browser that you can interact with.
- The ability to interact with the browser's DevTools.
- File downloading for testing PDFs/PNGs.
- Control over browser-specific parameters like headless and stealth.
- A tab-based layout with code-saving capabilities.
- The ability to save your code to disk as a NodeJS project.
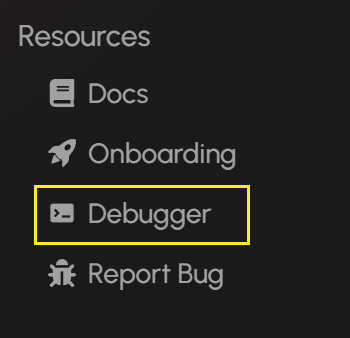
Inside your Browserless account, you will see an option in the menu linking to the debugger, under the Resources section:
And you will se the Live Debugger:
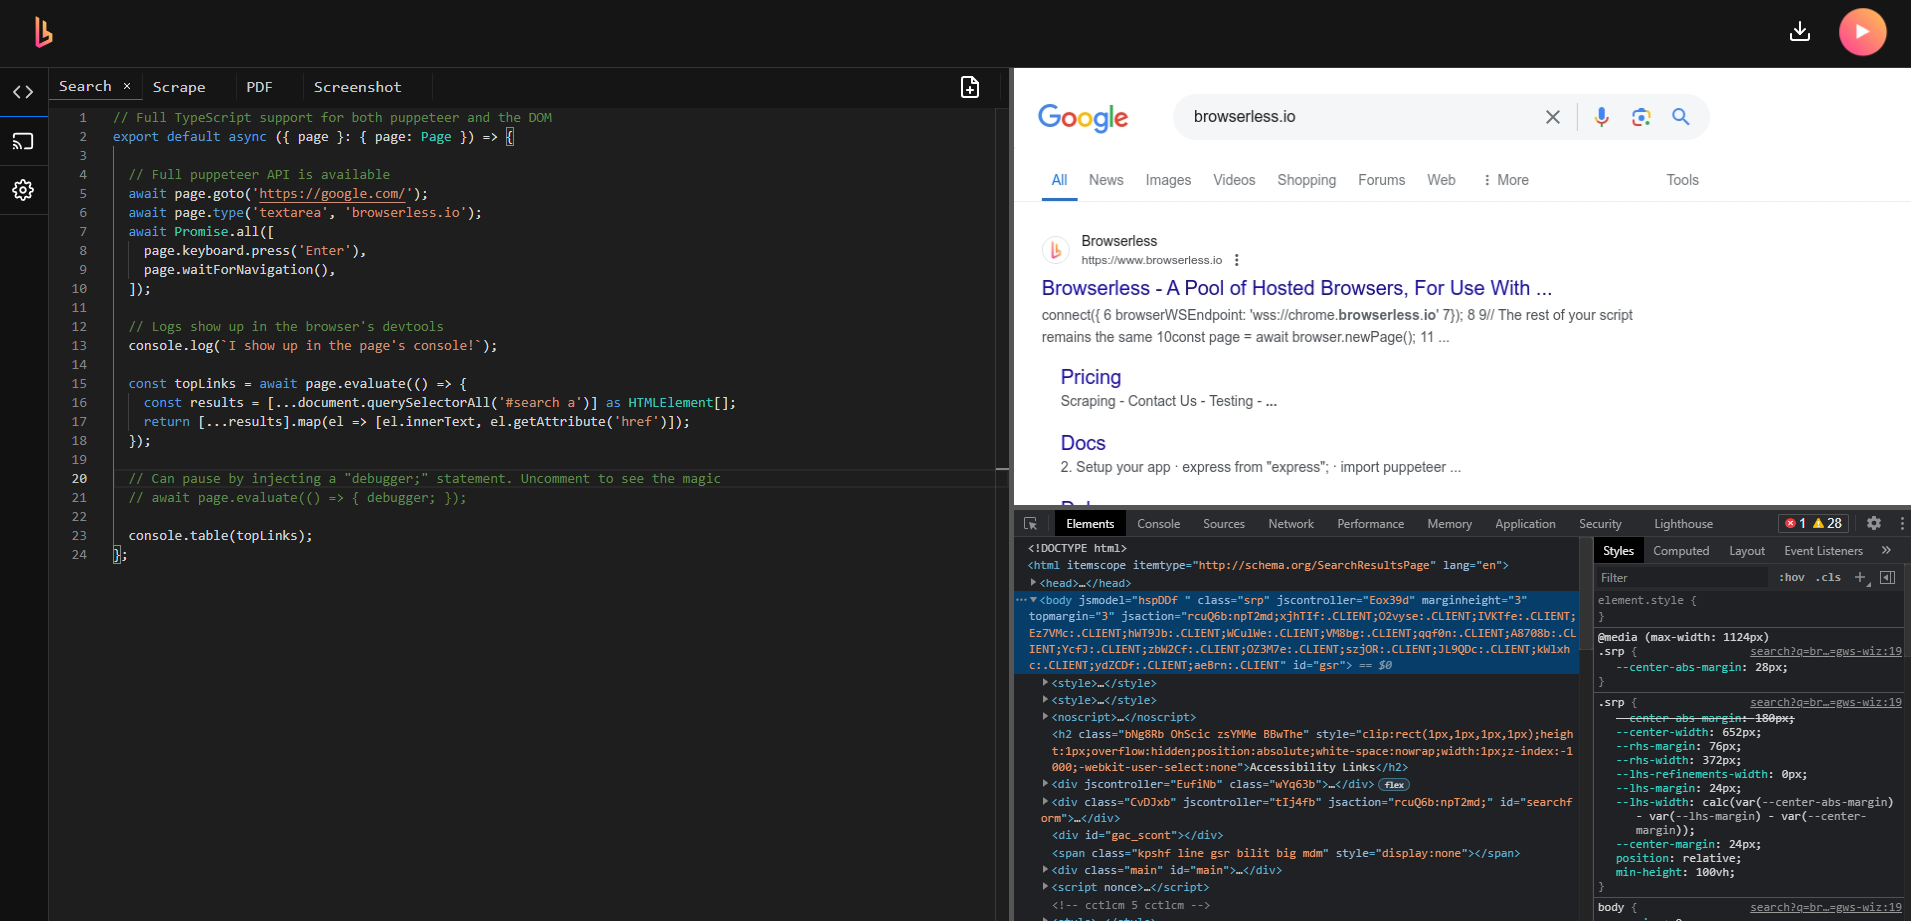
There you will be able connect to your worker's websocket enpoints, to set custom launch flags, and set session parameters.